


An AI-powered ATS that simplifies shortlisting, tagging, and workflows - built for fast, scalable, and collaborative hiring.
Landing Pages
Copyright © 2026|hiremore AI
An AI-powered ATS that simplifies shortlisting, tagging, and workflows - built for fast, scalable, and collaborative hiring.






Most ATS business cases die in the CFO’s inbox for the same reason: inflated savings claims that nobody believes. ATS ROI is the measurable return an applicant tracking system generates against its total cost, and when you calculate it conservatively, time recovered, cost per hire reduced, vacancy days cut, the honest number is usually strong enough that you don’t need the inflated one.
This guide is for TA leaders and HR directors who need budget approval, and for the finance partners reviewing their math. You’ll get a 4-part ROI model, the loaded-cost formulas finance teams actually accept, a worked example for a 150-hire company, and the traps that make business cases collapse under questioning.
One framing rule up front: count conservatively, attribute honestly, and put risk reduction in words rather than dollars. A defensible 140% ROI beats a doubted 400% every time.
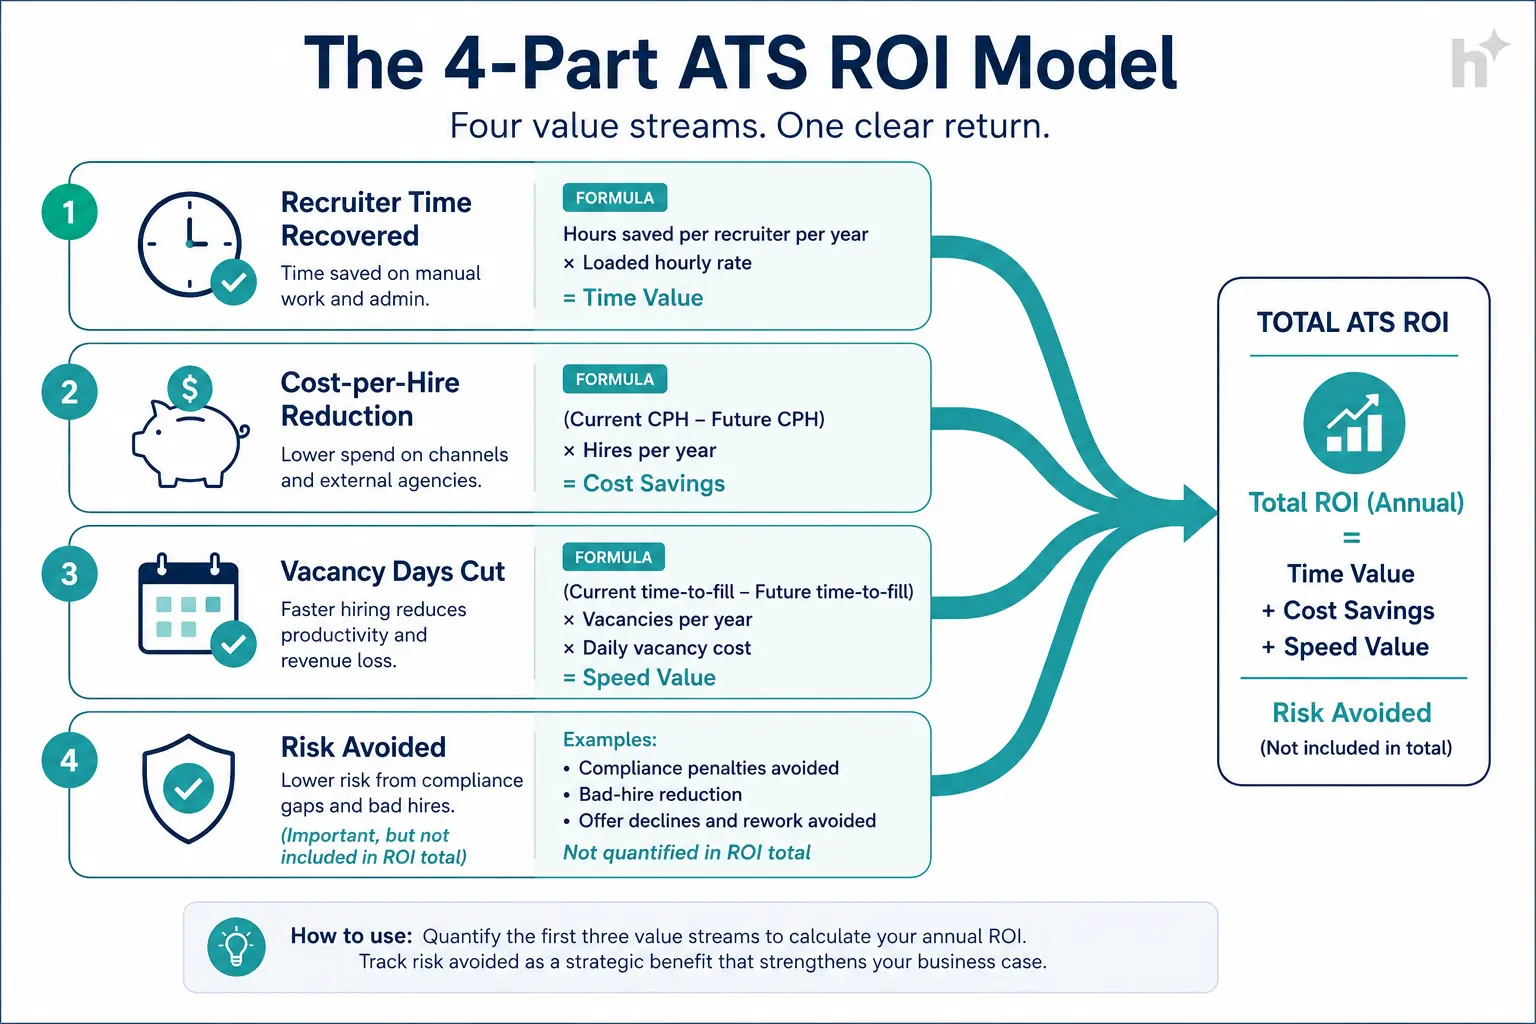
- ATS ROI is calculated from four value streams: recruiter time recovered, cost-per-hire reduction, vacancy days eliminated, and risk avoided, with the first three quantified in dollars and the fourth argued qualitatively.
- Recruiter time is the largest stream for most teams: 8 to 15 hours recovered weekly per recruiter, valued at loaded cost (salary × 1.25 to 1.4), not base salary.
- Vacancy cost makes the case for revenue-linked roles: an unfilled sales seat carrying a $1M quota costs roughly $19,000 per vacant week in lost pipeline coverage.
- Total cost must include implementation, integrations, and training: year-one cost typically runs 1.5 to 2x the license fee, and ignoring that gap is the fastest way to lose finance’s trust.
- A typical mid-market ATS business case lands at 100 to 200% first-year ROI with a 10 to 16 month payback when counted conservatively. Claims far above that range invite the scrutiny that kills proposals.
ATS ROI is the financial return an applicant tracking system delivers, time savings, cost reductions, and faster hiring, divided by its total cost of ownership, expressed as a percentage or payback period.
The formula itself is ordinary: ROI = (annual value − annual cost) ÷ annual cost × 100. The craft is in what you count. Value comes from four streams: recruiter hours recovered by automation, direct cost-per-hire reductions (agency fees, wasted job board spend), vacancy days eliminated by faster fills, and risk avoided (compliance exposure, bad-hire costs).
Cost is everything, not just the license: implementation, integration work, training time, and internal project hours. Two definitions worth fixing before any spreadsheet opens:
Loaded cost: salary plus benefits, taxes, and overhead, typically salary × 1.25 to 1.4. Time savings valued at base salary undercount by a quarter or more.Payback period: months until cumulative value exceeds cumulative cost. Finance teams often trust this number more than an ROI percentage.The business case matters because ATS spending competes against every other budget line, and “recruiters will be more efficient” loses to any proposal with actual numbers attached.
There’s a structural reason TA teams struggle here: recruiting’s costs are visible (salaries, job boards, agency fees) while its waste is invisible (hours lost to scheduling email chains, candidates lost to slow processes, requisitions reopened after avoidable bad hires). A business case is the act of making the invisible waste visible and pricing it.
It also disciplines the purchase itself. Teams that build a real ROI model before buying consistently buy better, because the model forces the question “which features produce these returns?” That’s how you avoid paying for the 20 features nobody opens.
And the honest version protects you after the purchase. A conservative model with named assumptions becomes the post-purchase scorecard: you committed to 8 hours saved per recruiter weekly, and at 90 days you either show it or explain it. Inflated cases can’t survive that meeting. Honest ones get next year’s budget approved in ten minutes.
📊 Key Stat: SHRM benchmarks average cost per hire near $4,700, and unfilled-role costs for revenue roles routinely exceed the entire annual ATS license within 2 to 3 vacant weeks. The raw material for a strong case exists at almost every company. It’s usually just uncounted.
The four value streams, in typical order of size: recruiter time recovered, vacancy days eliminated, direct cost-per-hire reduction, and risk avoided.
Recruiter time recovered. Scheduling automation, screening assistance, and status communication recover 8 to 15 hours weekly per recruiter. At a $75k salary with a 1.3 load factor (about $47/hour), 10 hours weekly is roughly $24,400 per recruiter per year. This stream alone often covers the license.
Vacancy days eliminated. Faster screening and scheduling cut time to fill by 15 to 30% in well-run implementations. For revenue and operations roles, each vacancy day has a cost; even pricing only your revenue-linked roles keeps the math conservative and compelling.
Direct cost-per-hire reduction. Source-of-hire data redirects spend from boards that don’t produce to channels that do, and better pipelines reduce agency dependence. Teams commonly cut 20 to 40% of external sourcing spend within a year of getting reliable source data.
Risk avoided. Compliance tooling, audit trails, and structured processes reduce exposure to discrimination claims and bad hires (a bad hire costs 50 to 200% of annual salary to replace). Count this stream in words, not dollars: it strengthens the narrative without inviting an argument about probabilities.
| Value Stream | How It’s Valued | Typical Annual Size (10-recruiter team) |
|---|---|---|
| Recruiter time | Hours saved × loaded rate | $120k to $240k |
| Vacancy reduction | Days cut × daily vacancy cost (revenue roles only) | $30k to $80k |
| Cost-per-hire | Agency + board spend redirected | $20k to $60k |
| Risk avoided | Qualitative narrative | Argued, not priced |
💡 Pro Tip: Lead the business case with whichever stream your CFO already believes in. If they’ve personally chased a delayed sales hire, open with vacancy cost. If they think recruiting is overstaffed, open with time recovered. Same model, different front door.
Build the case in four steps: measure the baseline, price the costs completely, project conservative returns per stream, and present ROI plus payback with named assumptions.
Input: Two weeks of recruiter time tracking, current time to fill, cost per hire, and channel spend.
Process: Sample where data is missing: have 3 recruiters log scheduling, screening, and admin hours for 10 working days. Pull time to fill and source spend from existing records, even imperfect ones.
Output: A baseline nobody can dispute later, because it’s your own measured data.
Input: Vendor quotes, implementation estimates, your project time.
Process: Sum license, implementation, integration connectors, training hours (at loaded cost), and ongoing admin time. Year one typically lands at 1.5 to 2x license; later years near 1.1 to 1.2x.
Output: A 3-year total cost line that survives procurement review.
Input: The baseline, plus benchmark ranges for each stream.
Process: Apply haircuts: if automation typically saves 10 to 15 hours weekly, model 8. If time to fill typically drops 20 to 30%, model 15. Price vacancy cost only for revenue-linked roles. Exclude risk from the math entirely.
Output: Stream-by-stream annual value with every assumption written down.
Input: Costs and returns from steps 2 and 3.
Process: Show ROI percentage, payback month, and a sensitivity line (“if savings come in 30% lower, payback moves from month 13 to month 18”). The sensitivity line is what makes finance relax.
Output: A one-page case with a defensible number and a measurement plan for proving it post-purchase.
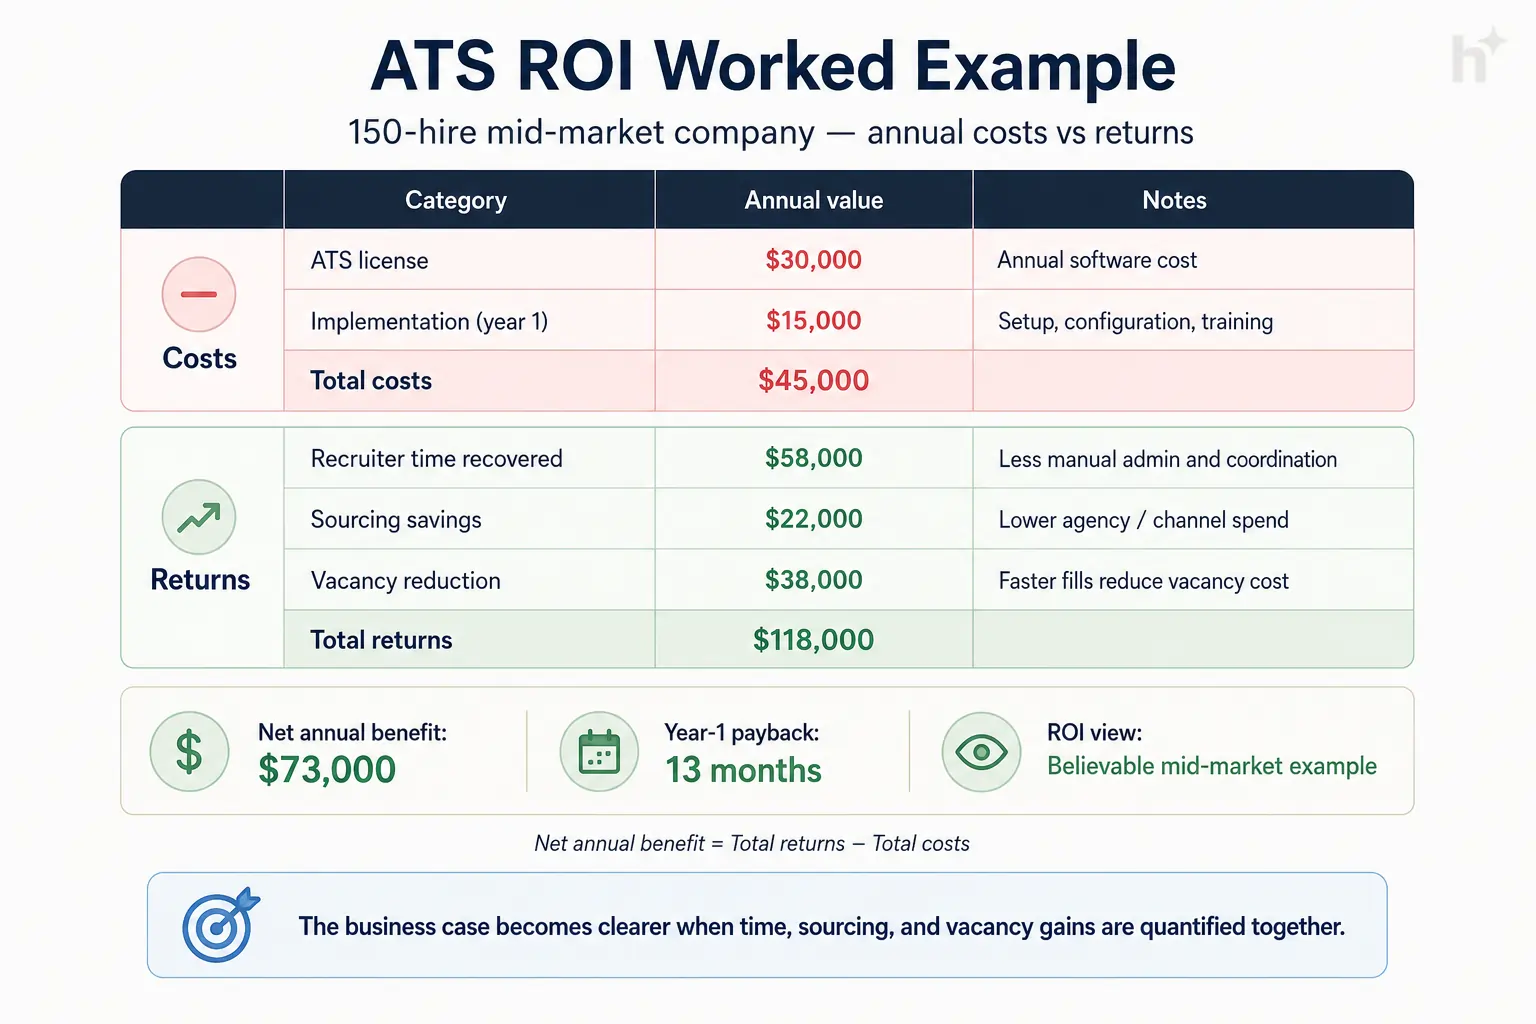
Worked example, 150 hires/year, 4 recruiters: Year-one cost: $30k license + $15k implementation = $45k. Returns: time recovered (8 hrs/wk × 4 recruiters × $47 loaded × 46 wks) ≈ $69k, sourcing savings $22k, vacancy reduction (priced on 30 revenue roles only) $38k. Total ≈ $129k. Year-one ROI ≈ 187%, payback month 5 on a run-rate basis, or month 13 if you only credit savings after a 90-day adoption ramp. Present the ramped version. It’s the believable one.
The single most impactful practice is writing every assumption next to its number, because a business case is only as strong as its most attackable line.
Name every assumption. Before: “$120k in efficiency savings” floats unexplained and one skeptical question sinks the meeting. After: “8 hrs/week × 4 recruiters × $47 loaded rate × 46 weeks” invites checking instead of doubt. Cases with visible math get approved faster.
Use loaded cost, and say so. Before: time valued at base salary undercounts 25 to 40% and looks naive to finance. After: salary × 1.3 with the multiplier stated. Finance recognizes their own convention and trusts the rest more.
Haircut the benchmarks. Before: vendor case studies (“customers save 40%!”) pasted into your model. After: benchmark ranges cut by a third, with the haircut noted. Underpromising here is what makes your 90-day review a victory lap.
Price vacancy cost narrowly. Before: every role assigned a daily vacancy cost, inviting an unwinnable debate. After: only quota-carrying and production-critical roles priced, everything else listed as unpriced upside.
Commit to a measurement date. Before: the case is approved and never revisited. After: a 90-day and 12-month review against the model’s own numbers is part of the proposal. This single line signals confidence more than any projection.
| Condition | Recommended Action | Expected Outcome |
|---|---|---|
| CFO skeptical of soft savings | Lead with vacancy cost on named open roles | Concrete, checkable anchor |
| No baseline data exists | 2-week time sample, 3 recruiters | Defensible baseline in 10 days |
| Replacing an existing ATS | Model the delta, not the gross value | Honest case that survives “don’t we have this?” |
| High agency spend | Lead with sourcing redirection stream | Fastest visible payback |
⚠️ Watch Out: Never present run-rate savings as year-one savings. Adoption takes a quarter, and finance knows it. Model a 90-day ramp at 50% value: it moves payback by a few months and multiplies your credibility.
The most common challenge is the missing baseline: you can’t show savings against numbers you never measured.
Nobody tracked scheduling hours or screening time before. Solution: a 2-week structured time sample with 3 recruiters produces a defensible baseline in 10 working days. Imperfect and measured beats precise and imaginary.
The incumbent’s unused features muddy the delta. Solution: model the replacement case on outcomes, not features: current measured time to fill and recruiter hours versus projected, regardless of what the old system theoretically offered.
Time to fill improved, but the market also softened. Solution: pre-register your metrics and comparison windows in the proposal, segment by role family, and acknowledge confounders in the review rather than letting skeptics raise them first.
Budget cycles don’t care about your payback math. Solution: size the cost of waiting using your own model: a case showing $10k/month of net value makes “next fiscal year” a $60k decision, which is a different conversation.
Honest ROI cases get approved, and conservative models routinely outperform their own projections, which is exactly the position you want at renewal time.
Logistics company, 300 hires/year. Problem: two failed budget requests for an ATS upgrade, both built on vendor savings claims. Intervention: rebuilt the case on a 2-week time baseline and vacancy costs for 40 driver and dispatcher roles only, projecting 130% year-one ROI. Measured outcome: approved in one cycle; the 12-month review showed 168% actual ROI, and the team’s next tooling request was approved without debate.
SaaS company, 8 recruiters. Problem: CFO viewed recruiting tools as cost, not investment, after a previous shelfware purchase. Intervention: proposal included a 90-day measurement commitment against three numbers: scheduling cycle time, recruiter hours, agency spend. Measured outcome: at 90 days, scheduling had dropped from 3 days to 7 hours and agency spend was down 31%; the renewal conversation took one email.
Healthcare network, agency-heavy hiring. Problem: $1.9M annual agency spend for nursing roles, no internal pipeline visibility. Intervention: business case centered on a single stream: redirecting 25% of agency volume through better pipeline management and referral tracking. Measured outcome: agency spend fell $410k in year one against an $85k total platform cost, a result nobody needed a model to appreciate.
💡 Pro Tip: The healthcare case shows the single-stream strategy: when one value stream is overwhelming, build the entire case on it and treat everything else as a footnote. Simple cases survive meetings.
Track the exact metrics your business case projected, on the schedule it committed to. The post-purchase scorecard is the business case, re-run with actuals.
Recruiter hours recovered. Definition: weekly time saved versus baseline; your largest claimed stream. Calculation: repeat the 2-week time sample at day 90 and month 12. Target benchmark: 80%+ of the modeled hours by month 6.
Time to fill delta. Definition: change versus baseline, by role family. Calculation: median days, same families, same seasons. Target benchmark: the haircut number you modeled (e.g., 15%), with upside treated as bonus.
Sourcing spend redirected. Definition: agency and board spend moved or cut. Calculation: channel spend versus baseline year, normalized for hiring volume. Target benchmark: 20%+ where source data was the modeled lever.
Payback tracking. Definition: cumulative value versus cumulative cost, by month. Calculation: monthly value streams summed against all-in costs. Target benchmark: within 3 months of the modeled payback date.
Adoption rate. Definition: weekly active usage; the leading indicator behind every other number. Calculation: weekly actives ÷ licensed users. Target benchmark: 85%+ by day 90, because no adoption means no ROI regardless of the model.
| Metric | What It Measures | How to Calculate | Target Benchmark |
|---|---|---|---|
| Hours recovered | Time stream actuals | Repeat time sample, day 90 / month 12 | 80%+ of model by month 6 |
| Time to fill delta | Speed stream actuals | Median vs baseline, by family | ≥ modeled haircut % |
| Spend redirected | Cost stream actuals | Channel spend vs baseline | 20%+ where modeled |
| Payback | Overall case health | Cumulative value vs cost | Within 3 months of model |
| Adoption | Leading indicator | Actives ÷ licensed | 85%+ by day 90 |
The highest-severity risk is the inflated case: a business case that wins approval on numbers it can’t deliver poisons trust for every future request.
The inflated case. A 400% ROI built on vendor maximums gets approved once and audited forever. Mitigation: haircuts, ramps, and a measurement commitment. Your second purchase depends on your first model’s honesty.
Counting gross instead of delta. Replacing an existing system but claiming full value, as if the old system did nothing. Mitigation: model only the improvement over current measured performance.
Ignoring adoption risk. The model assumes 100% usage from day one. Mitigation: a 90-day ramp at 50% value, and an adoption plan in the proposal itself.
Double counting. Recruiter time savings and cost-per-hire reductions can overlap (the recruiter hours ARE part of cost per hire). Mitigation: define streams to be mutually exclusive, and say so in a footnote. Finance will check.
⚠️ Watch Out: If your model only works with the vendor’s best-case numbers, you don’t have a business case. You have a brochure with your logo on it.
ROI measurement is moving into the platforms themselves, with adoption and value dashboards making the post-purchase scorecard automatic rather than annual.
Built-in value reporting. Platforms increasingly ship dashboards tracking hours saved, scheduling cycle times, and funnel speed natively, which turns the 90-day review from a project into a screenshot.
Outcome-based pricing. A growing minority of vendors price per hire or per qualified shortlist, which moves ROI from your spreadsheet into the contract structure itself. Worth modeling both ways when offered.
AI value streams entering the model. Screening assistance, conversational scheduling, and automated communication are adding measurable streams to the classic model, and they concentrate in the recruiter-time stream, making time baselines more valuable to measure well.
Sum the annual value of three quantified streams (recruiter hours recovered at loaded cost, cost-per-hire reductions, vacancy days eliminated for revenue-linked roles), subtract total annual cost (license plus implementation, integrations, and training), and divide by that total cost. Express it as a percentage and a payback month, and write every assumption next to its number.
Conservatively modeled mid-market cases typically land at 100 to 200% first-year ROI with payback in 10 to 16 months. Claims far above that range usually signal vendor-supplied assumptions, and finance teams treat them accordingly. A defensible 140% beats a doubted 400%.
License fees, implementation services, integration connectors, training time at loaded cost, internal project hours, and ongoing administration. Year one typically runs 1.5 to 2x the license fee. A cost line that’s only the license is the first thing a CFO will catch.
Run a 2-week structured time sample before purchase: 3 recruiters log hours spent on scheduling, screening, and administrative tasks. Repeat the same sample at day 90 and month 12 post-implementation. Value the difference at loaded cost (salary × 1.25 to 1.4), and model only 80% of benchmark savings to stay conservative.
For revenue-linked roles, divide the role’s annual revenue responsibility by working days: a $1M-quota sales seat costs roughly $19,000 per vacant week in pipeline coverage. For operational roles, use overtime and contractor backfill costs. Price only the roles where the logic is airtight and list the rest as unquantified upside.
With conservative modeling and a 90-day adoption ramp, most mid-market implementations reach payback in 10 to 16 months. Single-stream cases with large agency spend to redirect can pay back in under 6 months, as in organizations cutting six figures of agency fees in year one.
A strong ATS ROI case is mostly discipline: measure your own baseline, price the total cost honestly, haircut every benchmark, and commit to reviewing your own numbers in 90 days. The conservative case wins twice, once at approval, and again when the actuals beat it.
The tension is permanent: advocacy pushes the numbers up, credibility pushes them down. Resolve it by letting the model be boring and the measured results be the headline.
If you’re building an ATS ROI case right now, hiremore AI ships with the value dashboards that make the 90-day review a screenshot instead of a project: hours saved, cycle times, and funnel speed tracked from day one. Bring your baseline. We like teams that measure.
Ready to hire smarter?
Build structured pipelines, screen candidates with AI, and keep your team aligned from first application to final offer.
